
Read an experiment in this order
Start with the whole experiment and narrow down:- Matrix shows which task, agent, and treatment combinations passed, and what they cost.
- Comparisons answers the experiment’s question first: who did better, and how sure that is. When Insights has reviewed the runs, the Brief under a difference lists the frictions seen with the side that did worse.
- Frictions ranks the problems agents hit, starting with the ones that stopped the most runs.
- Runs lists every run. Open a failed run, or one with a friction, to read its run details.
Pass rate and lift
Pass rate is the share of runs that passed the task’s rubric in Evals. A blocked run wasn’t evaluated, so it doesn’t count. Each trial is one run, so a cell’s pass rate is over its trials. Agents don’t give the same result every time, so repeats give you a pass rate you can trust. Lift is the difference in pass rate between a treatment and the baseline you chose at launch. Matrix shows no lift number, so compare cells:- Set the Matrix metric to Evals.
- Find the treatment’s cell and the baseline’s cell for the same task and agent.
- Hover over each one to see how many trials passed.
Matrix
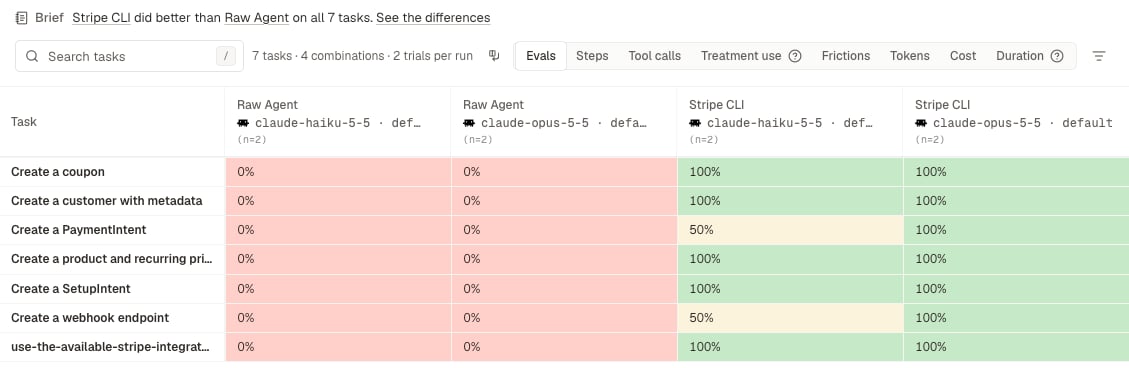
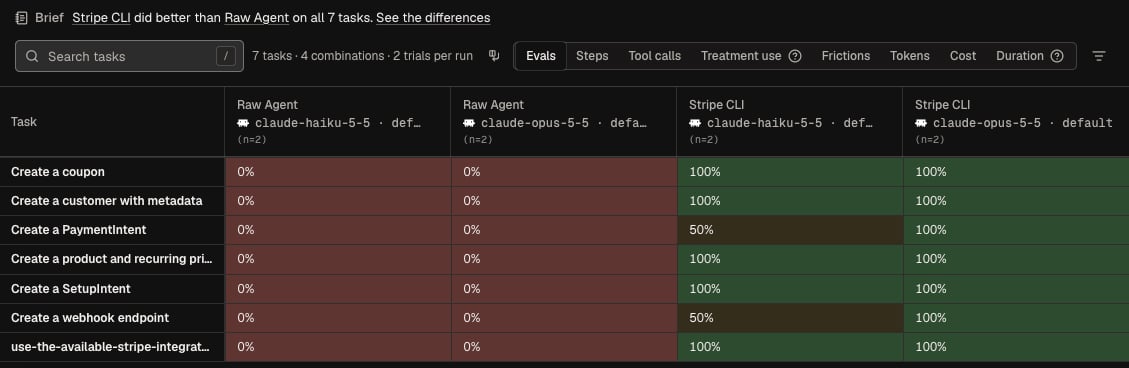
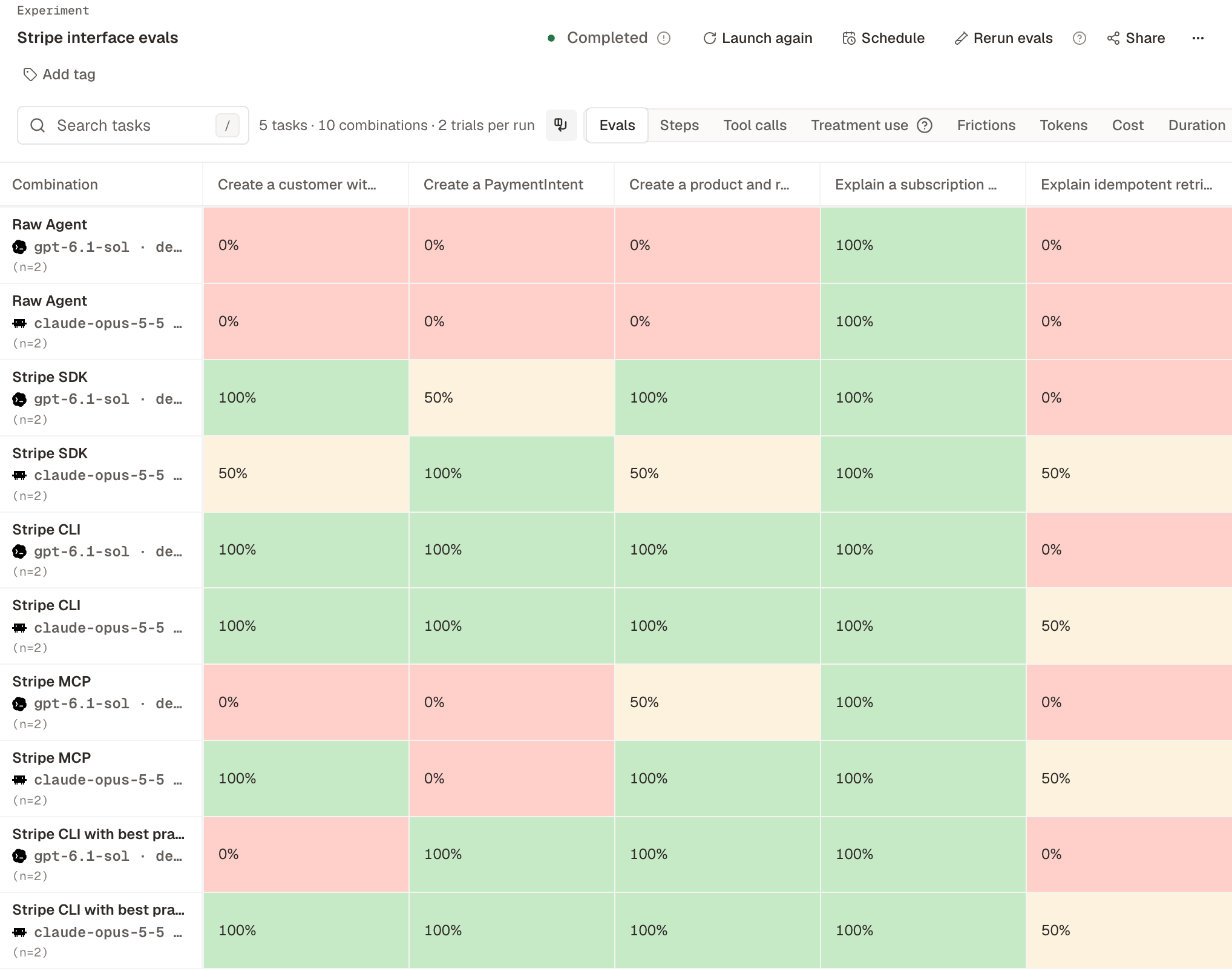
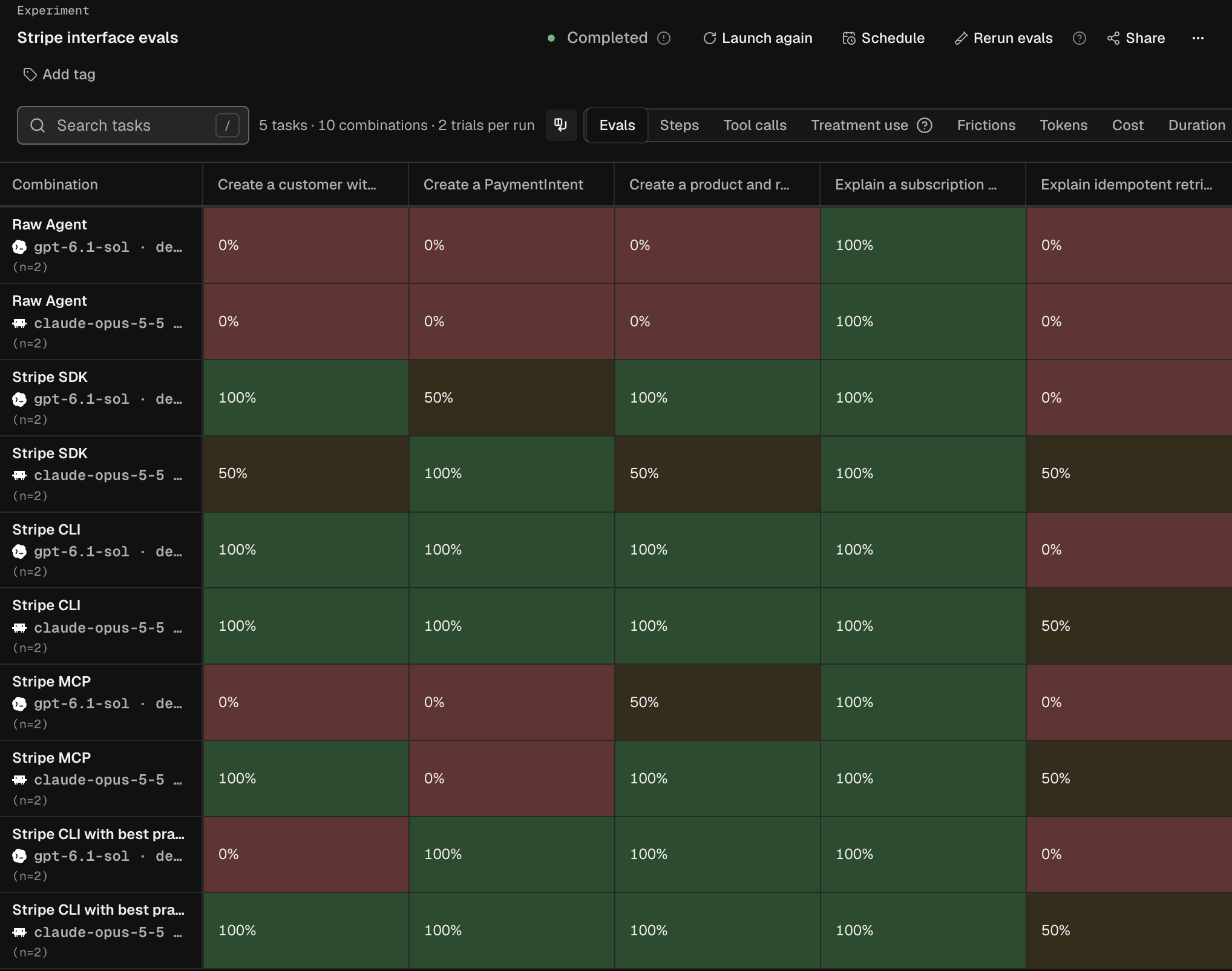
Matrix is a heat map of the experiment. By default, rows are tasks and columns are agent and treatment combinations. Each cell shows one metric, averaged over its trials. Pick the metric with Matrix metric:
Hover over a cell for details. Pass rate and treatment use cells say how many trials counted, for example “3 of 4 trials passed”. Other metrics show the average, minimum, maximum, and spread. A
* marks a cell where some trials didn’t finish or didn’t report the metric.
Above the grid, one line gives the sentence that opens Comparisons, such as “Stripe CLI did better than Raw Agent on all 7 tasks.” When the experiment has a Brief about a difference, the line starts with Brief and links to See the differences. Otherwise it starts with Comparisons and links to See the comparison, or to See all N comparisons when there are two or more. When Comparisons has nothing to compare, there’s no line.
Runs
Runs lists every run with its task, treatment (toolset), agent, trial, Evals result, and metrics. Select a row to open the run. The Treatment use column says whether the agent used the treatment. A blank cell means the run has no run profile.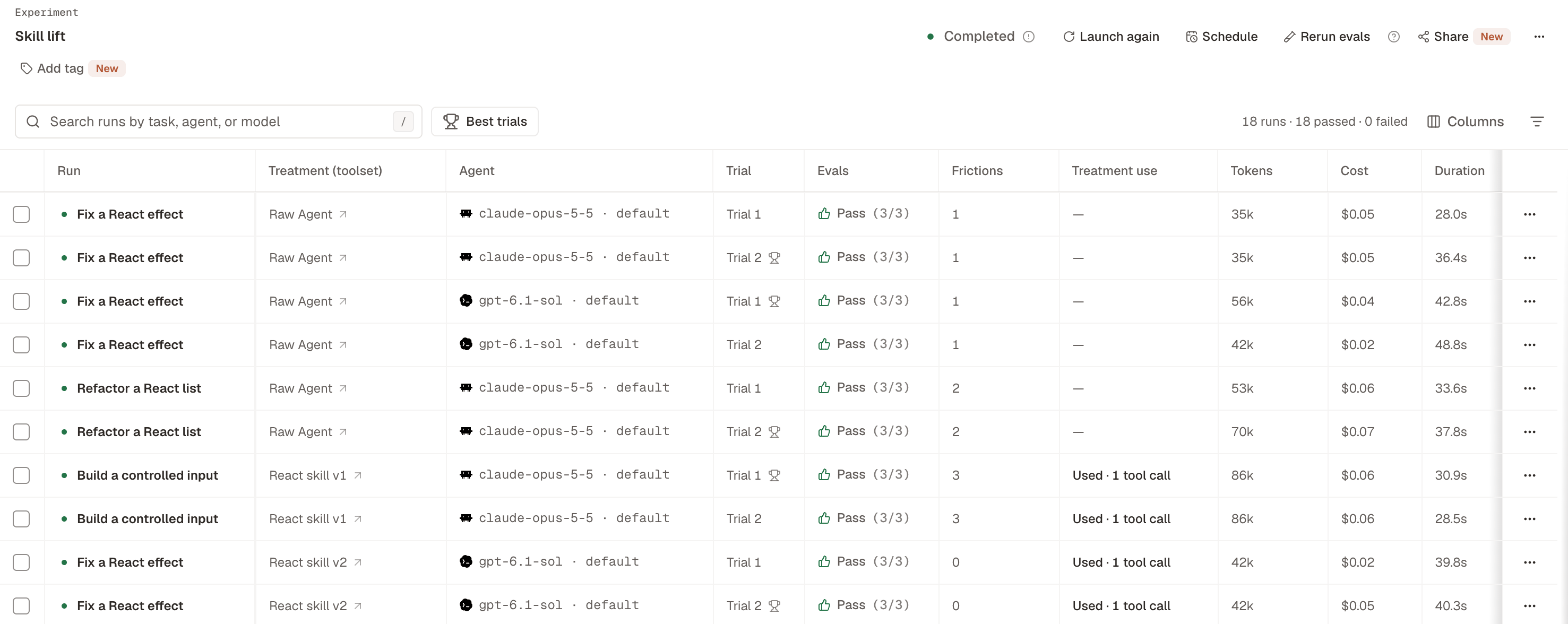
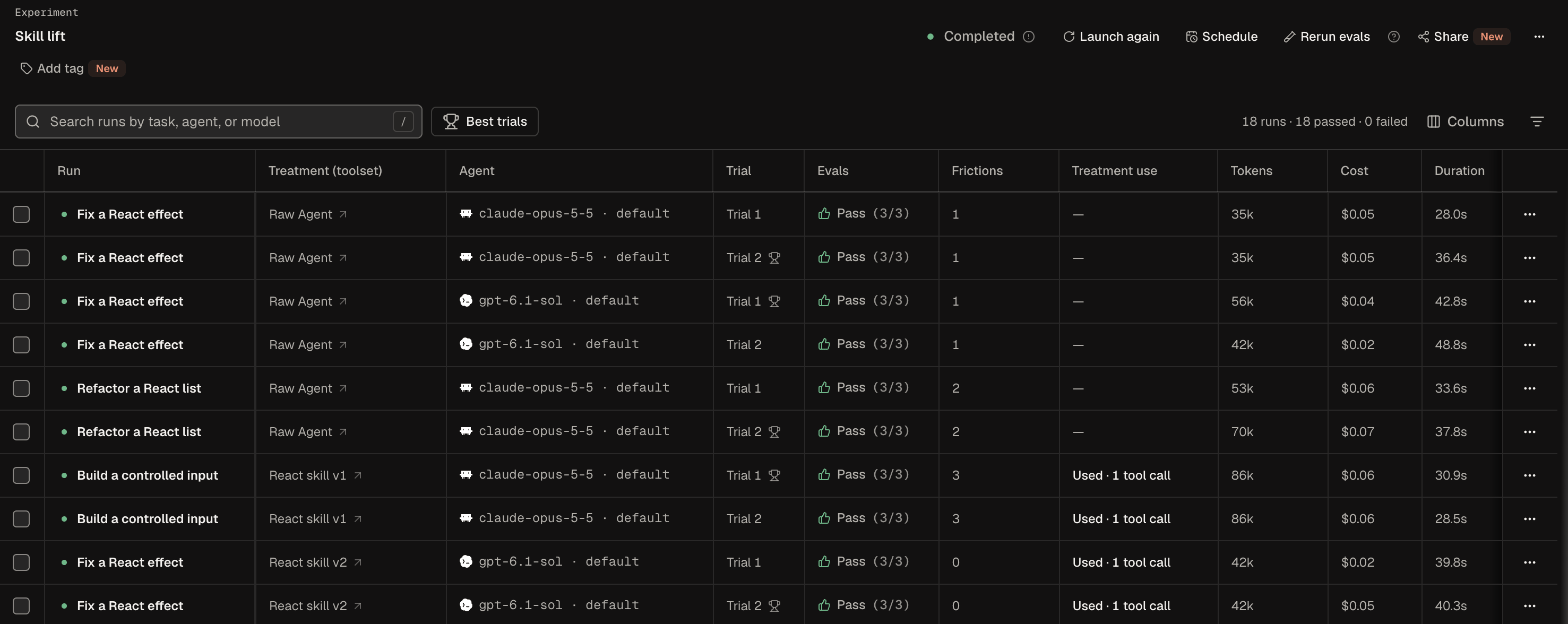
- Search runs by task, agent, or model finds runs by name.
- Evals, Status, Treatment (toolset), and Agent filter the rows. Treatment (toolset) appears when the runs used more than one treatment, and All runs adds an Experiment filter.
- Best trials keeps the best trial of each task, treatment, and agent.
Compare runs side by side
To see how different agents or treatments handled the same work, select two or three runs on Runs, then select Compare. Each run gets a column with its Traces, Output, and Evals, and each Traces column starts with the Timeline and the Run profile. You can also select Compare on an open run. It stays the first column, and you can add up to two more runs. Its other trials and other runs of the same task come first, and you can search the whole project.Find results across the project
The Analyze group in the sidebar collects results from every experiment:
Ask Obss, or your AI assistant through the Obss Plugin, can summarize a Matrix, the top frictions, or a single run.